It's 2:32 PM on a Tuesday. You're in the middle of a code review when Slack explodes.
"Checkout is broken." "Users can't pay." "The dashboard says everything is green???"
Sound familiar?
Here's the uncomfortable truth: monitoring tells you something broke. Observability tells you why. And that distinction? It's the difference between an 18-minute fix and a 4-hour war room.
The Problem with "Green Dashboards"
Most teams monitor their systems like they're still running monoliths. But modern software is distributed, asynchronous, and constantly failing in small ways. Microservices call other microservices. Background jobs process events from queues. Third-party APIs time out unpredictably.
Your dashboard shows HTTP 200? Great. But consider this response:
{
  "status": 200,
  "body": {
    "success": false,
    "reason": "insufficient_funds"
  }
}
Server: Success. User: Can't buy anything.
If you're counting HTTP 200s as "successful checkouts," your reliability metrics are lying to you.
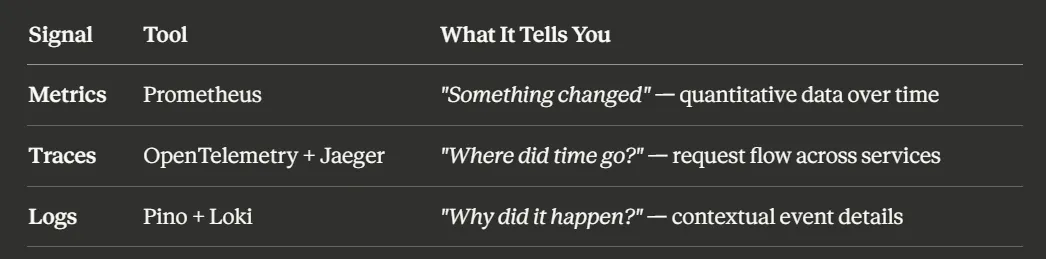
The Observability Stack: What You'll Need
Before we dive into code, let's understand the tools we're using and what you need to run them.
Prometheus (Metrics)
Prometheus is a monitoring and alerting system with a time-series database. It commonly scrapes metrics from services on a configured interval and queries them with PromQL. Alert rules are evaluated by Prometheus; notification routing and grouping are normally handled by Alertmanager.
For this Node.js example you need a Prometheus server, prom-client, and a protected /metrics endpoint reachable by Prometheus. Resource needs depend on active series, scrape frequency, retention, and query load; there is no meaningful universal RAM minimum.
# Quick start with Docker
docker run --rm -p 9090:9090 prom/prometheus:v3.14.0
OpenTelemetry (Traces)
OpenTelemetry provides vendor-neutral APIs, SDKs, semantic conventions, and protocols for traces, metrics, and logs. Think of it as the "USB-C of observability": one instrumentation model with multiple compatible exporters and backends. Portability is strong, not automatic; backend features, sampling, supported signals, and semantic-convention versions still differ.
# Install OpenTelemetry for Node.js
npm install @opentelemetry/api @opentelemetry/sdk-node @opentelemetry/auto-instrumentations-node
npm install @opentelemetry/exporter-trace-otlp-proto
Initialize the SDK before loading instrumented application modules, configure an exporter, and shut the SDK down gracefully so buffered spans can flush. Installing the packages alone does not send telemetry.
Jaeger or Grafana Tempo (Trace Backend)
A backend stores and queries traces. Jaeger is straightforward for local development; Tempo integrates tightly with Grafana. Production suitability depends on scale, storage, operations, tenancy, and query requirements rather than one backend being universally “better.”
# Jaeger 2 all-in-one for development, with OTLP gRPC and HTTP receivers
docker run --rm --name jaeger \
  -p 16686:16686 -p 4317:4317 -p 4318:4318 \
  cr.jaegertracing.io/jaegertracing/jaeger:2.21.0
Then open http://localhost:16686 to see your traces.
Grafana (Visualization)
The dashboard layer that brings everything together - metrics from Prometheus, traces from Jaeger/Tempo, and logs from Loki. One place to see all three signals. Click from a spike in a metric to the slow traces to the error logs.
docker run --rm -p 3000:3000 grafana/grafana:13.2.2The official local image initially uses admin / admin; change credentials and configure authentication before exposing Grafana.
Minimum Viable Stack
If you're just getting started, here's the smallest setup that gives you real observability:
# prometheus.yml
global:
  scrape_interval: 15s

scrape_configs:
  - job_name: prometheus
    static_configs:
      - targets: ["localhost:9090"]
# compose.yaml
services:
prometheus:
image: prom/prometheus:v3.14.0
ports: ["9090:9090"]
volumes:
- ./prometheus.yml:/etc/prometheus/prometheus.yml:ro
jaeger:
image: cr.jaegertracing.io/jaegertracing/jaeger:2.21.0
ports: ["16686:16686", "4317:4317", "4318:4318"]
grafana:
image: grafana/grafana:13.2.2
ports: ["3000:3000"]The pinned versions make the example reproducible as reviewed; update them deliberately. This stack uses ephemeral storage and is for local development. For real workloads, size from measured cardinality and retention, add durable storage and authentication, and consider an OpenTelemetry Collector as a retrying, batching telemetry pipeline. A collector is not durable message storage unless you configure an appropriate queue and persistence.
Before instrumenting your code, verify the path end to end: Prometheus can scrape each service, the OpenTelemetry SDK exports through OTLP, the trace backend receives spans, Grafana has the intended data sources, and metric endpoints are not publicly exposed without controls.
Let's Build Something Real
Enough theory. Let's instrument an actual checkout flow using Prometheus and Node.js - the same patterns work in any language.
Here's our scenario: User clicks "Buy" → Checkout Service → Kafka → Payment Service → Stripe API. Three boundaries where things break. Three places we need visibility.
Step 1: Metrics That Actually Matter
Don't Measure Averages. Measure Pain.
An average can hide tail pain. If your average is 200 ms but 5% of requests wait 8 seconds, you have a problem it cannot describe. Use a histogram with buckets chosen around meaningful SLO thresholds. Prometheus quantiles from classic histograms are estimates whose error depends on those buckets.
// metrics.js
const prometheus = require('prom-client');
const allowedRegions = new Set(['eu', 'us', 'apac']);

// Create a histogram for HTTP request latency
const httpLatency = new prometheus.Histogram({
  name: 'checkout_http_duration_seconds',
  help: 'Checkout endpoint latency in seconds',
  labelNames: ['route', 'method', 'status_code', 'region'],
  buckets: [0.05, 0.1, 0.25, 0.5, 1, 2.5, 5, 10]
});

// Middleware to track every request
app.use((req, res, next) => {
  const end = httpLatency.startTimer();

  res.on('finish', () => {
    end({
      route: req.route?.path || 'unknown',
      method: req.method,
      status_code: res.statusCode,
      region: allowedRegions.has(req.headers['x-region'])
        ? req.headers['x-region']
        : 'unknown'
    });
  });

  next();
});
Now in Prometheus, you can query:
histogram_quantile(0.95,
  sum by (le, region) (
    rate(checkout_http_duration_seconds_bucket[5m])
  )
)
This estimates the 95th-percentile latency per region across service instances. The original buckets must retain their le label during aggregation. When the estimate jumps from 0.2 to 4.0 seconds, you know which bounded region segment is hurting.
Keep metric labels low-cardinality and controlled. Never put request IDs, order IDs, raw URLs, email addresses, or arbitrary header values in labels. A user-controlled x-region header must be mapped to a small allowlist, as above. Use normalized route templates rather than concrete paths.
Track Business Outcomes, Not Just HTTP Codes
Here's the metric that changed how we think about reliability:
// Track actual checkout outcomes
const checkoutAttempts = new prometheus.Counter({
  name: 'checkout_attempts_total',
  help: 'Total checkout attempts',
  labelNames: ['region', 'feature_flag']
});

const checkoutSuccess = new prometheus.Counter({
  name: 'checkout_success_total',
  help: 'Successful checkouts (payment authorized)',
  labelNames: ['region', 'feature_flag']
});

const checkoutDuration = new prometheus.Histogram({
  name: 'checkout_duration_seconds',
  help: 'End-to-end checkout duration',
  labelNames: ['region', 'feature_flag', 'outcome'],
  buckets: [0.1, 0.25, 0.5, 1, 2.5, 5, 10, 30]
});

// In your checkout handler
app.post('/checkout', async (req, res) => {
  const region = allowedRegions.has(req.headers['x-region'])
    ? req.headers['x-region']
    : 'unknown';
  const featureFlag = getFeatureFlag('checkout_v2', req.user)
    ? 'enabled'
    : 'disabled';
  const endCheckout = checkoutDuration.startTimer({
    region,
    feature_flag: featureFlag
  });
  let outcome = 'failed';

  checkoutAttempts.inc({ region, feature_flag: featureFlag });

  try {
    const result = await processCheckout(req.body);

    // Don't just check HTTP status - check business outcome
    if (result.payment.authorized && result.order.created) {
      checkoutSuccess.inc({ region, feature_flag: featureFlag });
      outcome = 'succeeded';
    } else {
      outcome = 'rejected';
    }

    res.json(result);
  } catch (err) {
    res.status(500).json({ error: 'Checkout failed' });
  } finally {
    endCheckout({ outcome });
  }
});
Your SLI (Service Level Indicator) becomes dead simple:
sum(rate(checkout_success_total[5m]))
/
sum(rate(checkout_attempts_total[5m]))
If your agreed SLO is 99.9%, values below 99.9% represent a burn rate above 1 for that window. That does not by itself mean you should page: use multiple windows, account for low traffic, and alert on actionable budget consumption.
Step 2: Traces That Survive Async Boundaries
Metrics tell you that something is wrong. Traces show where time and failures occurred. In-process async context is usually handled by the OpenTelemetry SDK; process and transport boundaries require context propagation. Supported instrumentation often injects it automatically, so prefer that before writing manual spans.
The Kafka Problem
When your Kafka client is not supported by active instrumentation, inject W3C trace context into message headers and extract it in the consumer. Do not duplicate manual spans if client instrumentation already creates them.
Producer (Checkout Service):
const {
  trace,
  context,
  propagation,
  SpanKind,
  SpanStatusCode
} = require('@opentelemetry/api');
const tracer = trace.getTracer('checkout-service');

async function publishPaymentRequest(order) {
  return tracer.startActiveSpan('publish payment.requested',
    {
      kind: SpanKind.PRODUCER,
      attributes: {
        'messaging.system': 'kafka',
        'messaging.destination.name': 'payment.requested',
        'messaging.operation.name': 'publish',
        'messaging.operation.type': 'send'
      }
    },
    async (span) => {
      const headers = {};
      propagation.inject(context.active(), headers);

      try {
        await producer.send({
          topic: 'payment.requested',
          messages: [{
            key: order.id,
            headers,
            value: JSON.stringify({
              orderId: order.id,
              amount: order.total,
              currency: order.currency
            })
          }]
        });
      } catch (error) {
        span.recordException(error);
        span.setStatus({ code: SpanStatusCode.ERROR });
        throw error;
      } finally {
        span.end();
      }
    }
  );
}
Consumer (Payment Service):
consumer.run({
  eachMessage: async ({ message }) => {
    const carrier = Object.fromEntries(
      Object.entries(message.headers ?? {}).map(([key, value]) => [
        key,
        value?.toString()
      ])
    );

    const parentContext = propagation.extract(
      context.active(),
      carrier
    );

    await context.with(parentContext, async () => {
      await tracer.startActiveSpan('process payment.requested',
        {
          kind: SpanKind.CONSUMER,
          attributes: {
            'messaging.system': 'kafka',
            'messaging.destination.name': 'payment.requested',
            'messaging.operation.name': 'process',
            'messaging.operation.type': 'process'
          }
        },
        async (span) => {
          try {
            if (!message.value) {
              throw new Error('payment.requested message has no value');
            }

            const payload = JSON.parse(message.value.toString());
            await processPayment(payload);
          } catch (err) {
            span.recordException(err);
            span.setStatus({ code: SpanStatusCode.ERROR });
            throw err;
          } finally {
            span.end();
          }
        }
      );
    });
  }
});
This is a single-message example. Current OpenTelemetry messaging conventions generally use span links to the message creation context because batches, fan-out, and ambient transport spans cannot always be represented by one parent. A single-message consumer may use the creation context as parent, but check the instrumentation you deploy. Messaging semantic conventions remain under development as of this review, so pin compatible package versions and dashboards rather than assuming attribute names will never change.
Now, when you click on a trace in Jaeger or Grafana Tempo, you see the entire journey:
checkout.request (4,180ms)
└─ publish payment.requested (5ms)
    └─ process payment.requested (4,165ms)
        └─ stripe.payment_intent (4,150ms) ← HERE'S YOUR PROBLEM
Without context propagation, you get disconnected telemetry and must correlate it through weaker clues. Propagation creates correlation; whether a backend renders producer and consumer work as one parent-child waterfall or linked traces depends on the messaging instrumentation model.
Step 3: Logs That Help (Not Hurt)
During an incident, you don't need more logs. You need the right logs. Emit structured records your pipeline can parse, and correlate them with trace and span IDs where available. OpenTelemetry's log data model has dedicated TraceId and SpanId fields; some logger integrations add them automatically.
Do not assume user IDs are harmless. Stable identifiers, order IDs, amounts, error messages, and trace IDs can all carry privacy, security, or retention implications. Log only fields with an operational purpose, redact centrally as defense in depth, restrict access, and serialize errors explicitly.
const logger = require('pino')();

async function processPayment(order) {
  const span = trace.getActiveSpan();
  const traceId = span?.spanContext().traceId;

  try {
    const result = await stripe.paymentIntents.create(
      {
        amount: order.amount,
        currency: order.currency,
        payment_method: order.paymentMethodId,
        confirm: true
      },
      {
        idempotencyKey: `checkout:${order.id}`
      }
    );

    if (result.status !== 'succeeded') {
      logger.warn({
        event: 'payment_requires_follow_up',
        trace_id: traceId,
        order_id: order.id,
        provider: 'stripe',
        payment_status: result.status
      });

      return result;
    }

    logger.info({
      event: 'payment_succeeded',
      trace_id: traceId,
      order_id: order.id,
      provider: 'stripe',
      currency: order.currency
    });

    return result;

  } catch (err) {
    logger.error({
      event: 'payment_failed',
      trace_id: traceId,
      order_id: order.id,
      provider: 'stripe',
      error_type: err.name,
      error_code: err.code
    });

    throw err;
  }
}
The idempotency key must identify one logical payment attempt and remain stable across safe retries. A real integration must also handle statuses such as requires_action and processing instead of treating creation of a Payment Intent as completed payment.
When things break, you search for a trace ID and retrieve correlated records retained by your telemetry pipeline. Sampling can mean a trace was not exported even when correlated logs exist, so logs must remain useful on their own.
The Incident That Proved All This
Here is a representative incident timeline. The timings are illustrative, but the diagnostic sequence is the one that matters.
14:32 UTC - Alert fires:
CRITICAL: Error budget burn rate 14.4x normal
Projected exhaustion: 2 days
Service: checkout
Step 1: Metrics Narrow the Scope (2 minutes). Open Grafana. Query our histogram:
histogram_quantile(0.99,
  sum by (le, region, feature_flag) (
    rate(checkout_duration_seconds_bucket[5m])
  )
)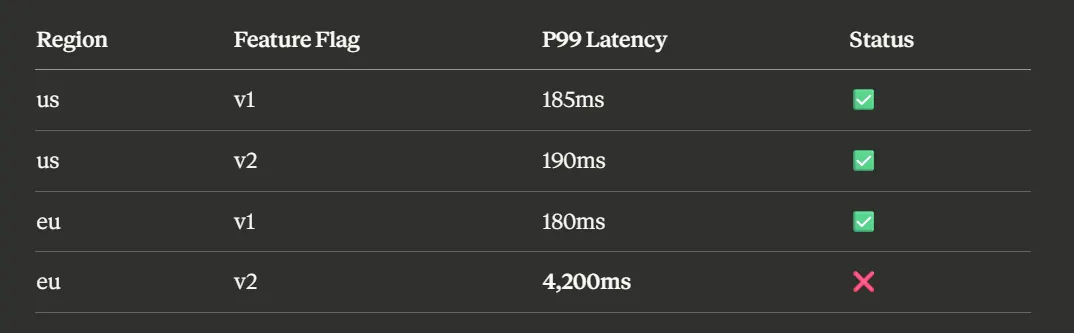
Isolated: EU users on the new checkout flow.
Step 2: Traces Reveal the Bottleneck (5 minutes). Click into a slow EU trace:
checkout.request (9,180ms)
└─ kafka.publish (5ms)
    └─ kafka.consume (9,165ms)
        └─ stripe.payment_intent (9,150ms)
            ├─ attempt 1: timeout (3,000ms)
            ├─ attempt 2: timeout (3,000ms)
            └─ attempt 3: timeout (3,000ms)
Smoking gun: Stripe is timing out. Three retries at 3 seconds each = 9+ second checkout.
Step 3: Logs Explain Why (3 minutes). Filter logs by the trace ID:
{
  "level": "error",
  "event": "stripe_timeout",
  "trace_id": "abc123...",
  "provider": "stripe-eu",
  "timeout_ms": 3000,
  "region": "eu"
}
The trace and logs show that the dependency regularly exceeds the configured 3-second attempt timeout in this region. Before changing it, verify the provider's current timeout/retry guidance and your own end-to-end deadline: three longer serial attempts can make user latency worse and amplify load.
The Fix (8 minutes). Immediate (2 min): Disable checkout_v2 for EU via feature flag. Short-term: align per-attempt timeout and retry count with the end-to-end checkout deadline, using bounded backoff and only retrying safe failures. Long-term: add a retry counter and dependency-latency SLO to catch retry storms early.
Total time: 18 minutes from alert to resolution. Without observability? We'd still be grepping logs, restarting services, and arguing about whether it's a "backend problem" or "Stripe's fault."
The Prometheus Setup: Putting It All Together
// metrics.js - Your complete metrics setup
const prometheus = require('prom-client');
const allowedRegions = new Set(['eu', 'us', 'apac']);

// Collect default Node.js metrics (memory, CPU, etc.)
prometheus.collectDefaultMetrics();

// Business metrics
const checkoutAttempts = new prometheus.Counter({
  name: 'checkout_attempts_total',
  help: 'Total checkout attempts',
  labelNames: ['region', 'feature_flag']
});

const checkoutSuccess = new prometheus.Counter({
  name: 'checkout_success_total',
  help: 'Successful checkouts',
  labelNames: ['region', 'feature_flag']
});

// Export zero-valued series before the first success or attempt.
for (const region of [...allowedRegions, 'unknown']) {
  for (const featureFlag of ['enabled', 'disabled']) {
    checkoutAttempts.labels(region, featureFlag).inc(0);
    checkoutSuccess.labels(region, featureFlag).inc(0);
  }
}

// Latency histogram
const checkoutDuration = new prometheus.Histogram({
  name: 'checkout_duration_seconds',
  help: 'End-to-end checkout duration',
  labelNames: ['region', 'feature_flag', 'outcome'],
  buckets: [0.1, 0.25, 0.5, 1, 2.5, 5, 10, 30]
});

// Downstream dependency health
const paymentProviderDuration = new prometheus.Histogram({
  name: 'payment_provider_duration_seconds',
  help: 'Payment provider API latency',
  labelNames: ['provider', 'operation', 'status'],
  buckets: [0.1, 0.5, 1, 2, 5, 10]
});

const paymentProviderRetries = new prometheus.Counter({
  name: 'payment_provider_retries_total',
  help: 'Payment provider retry count',
  labelNames: ['provider', 'reason']
});

// Expose metrics endpoint
app.get('/metrics', async (req, res) => {
  res.set('Content-Type', prometheus.register.contentType);
  res.end(await prometheus.register.metrics());
});

module.exports = {
  checkoutAttempts,
  checkoutSuccess,
  checkoutDuration,
  paymentProviderDuration,
  paymentProviderRetries
};
Put /metrics on an internal listener or protect it at the network layer. Metrics often reveal service names, routes, runtime details, and business volumes.
# prometheus.yml
global:
  scrape_interval: 15s

scrape_configs:
  - job_name: 'checkout-service'
    static_configs:
      - targets: ['checkout:3000']

  - job_name: 'payment-service'
    static_configs:
      - targets: ['payment:3000']
Alert Rules (Burn Rate, Not Thresholds)
groups:
  - name: checkout-slo
    rules:
      # Page only while both long and short windows show active budget burn.
      - alert: CheckoutErrorBudgetFastBurn
        expr: |
          (
            (
              1 - sum(rate(checkout_success_total[1h]))
                / sum(rate(checkout_attempts_total[1h]))
            ) > (14.4 * 0.001)
            and
            (
              1 - sum(rate(checkout_success_total[5m]))
                / sum(rate(checkout_attempts_total[5m]))
            ) > (14.4 * 0.001)
          )
        labels:
          severity: critical
        annotations:
          summary: "Checkout error budget burning fast"
          description: "At least 2% of the 30-day budget burned in 1 hour and the burn is still active"
          runbook: "https://wiki.internal/runbooks/checkout-slo"

      # A sustained 6x burn consumes 5% of the budget in 6 hours.
      - alert: CheckoutErrorBudgetSlowBurn
        expr: |
          (
            (
              1 - sum(rate(checkout_success_total[6h]))
                / sum(rate(checkout_attempts_total[6h]))
            ) > (6 * 0.001)
            and
            (
              1 - sum(rate(checkout_success_total[30m]))
                / sum(rate(checkout_attempts_total[30m]))
            ) > (6 * 0.001)
          )
        labels:
          severity: critical
        annotations:
          summary: "Checkout error budget burning persistently"
          description: "At least 5% of the 30-day budget burned in 6 hours and the burn is still active"
For a 99.9% SLO, the allowed error ratio is 0.001. A continuous 14.4x burn would exhaust a 30-day budget in about 2.1 days; over the one-hour alert window it consumes 2% of that budget. A continuous 6x burn would exhaust it in 5 days; over six hours it consumes 5%. Google SRE's recommended starting point pages on both conditions, paired with 5-minute and 30-minute windows so recovered incidents reset sooner. Tune notification policy to your service, and add explicit handling for low or absent traffic before using these rules in production.
The Mindset Shift
Observability isn't about tools. It's not about having more dashboards or fancier log aggregators.
Observability is the design of systems that can explain themselves.
When your checkout breaks at 2 PM on a Tuesday, you shouldn't need tribal knowledge, log archaeology, or "that one engineer who knows the payment system."
You should need 18 minutes and the right queries.
That's not tooling. That's an engineering discipline.
Sources
- Prometheus: Histograms and summaries
- Prometheus: Instrumentation and label-cardinality guidance
- Google SRE Workbook: Alerting on SLOs
- OpenTelemetry JavaScript: Context propagation
- OpenTelemetry: Semantic conventions for messaging spans
- OpenTelemetry: Logs data model
- Jaeger 2: Getting started
- Prometheus: Current releases
- Grafana: Current release downloads